How to track a container vessel?
Are you willing to track precise movements of a container vessel around the world and follow up which ports it calls over time?
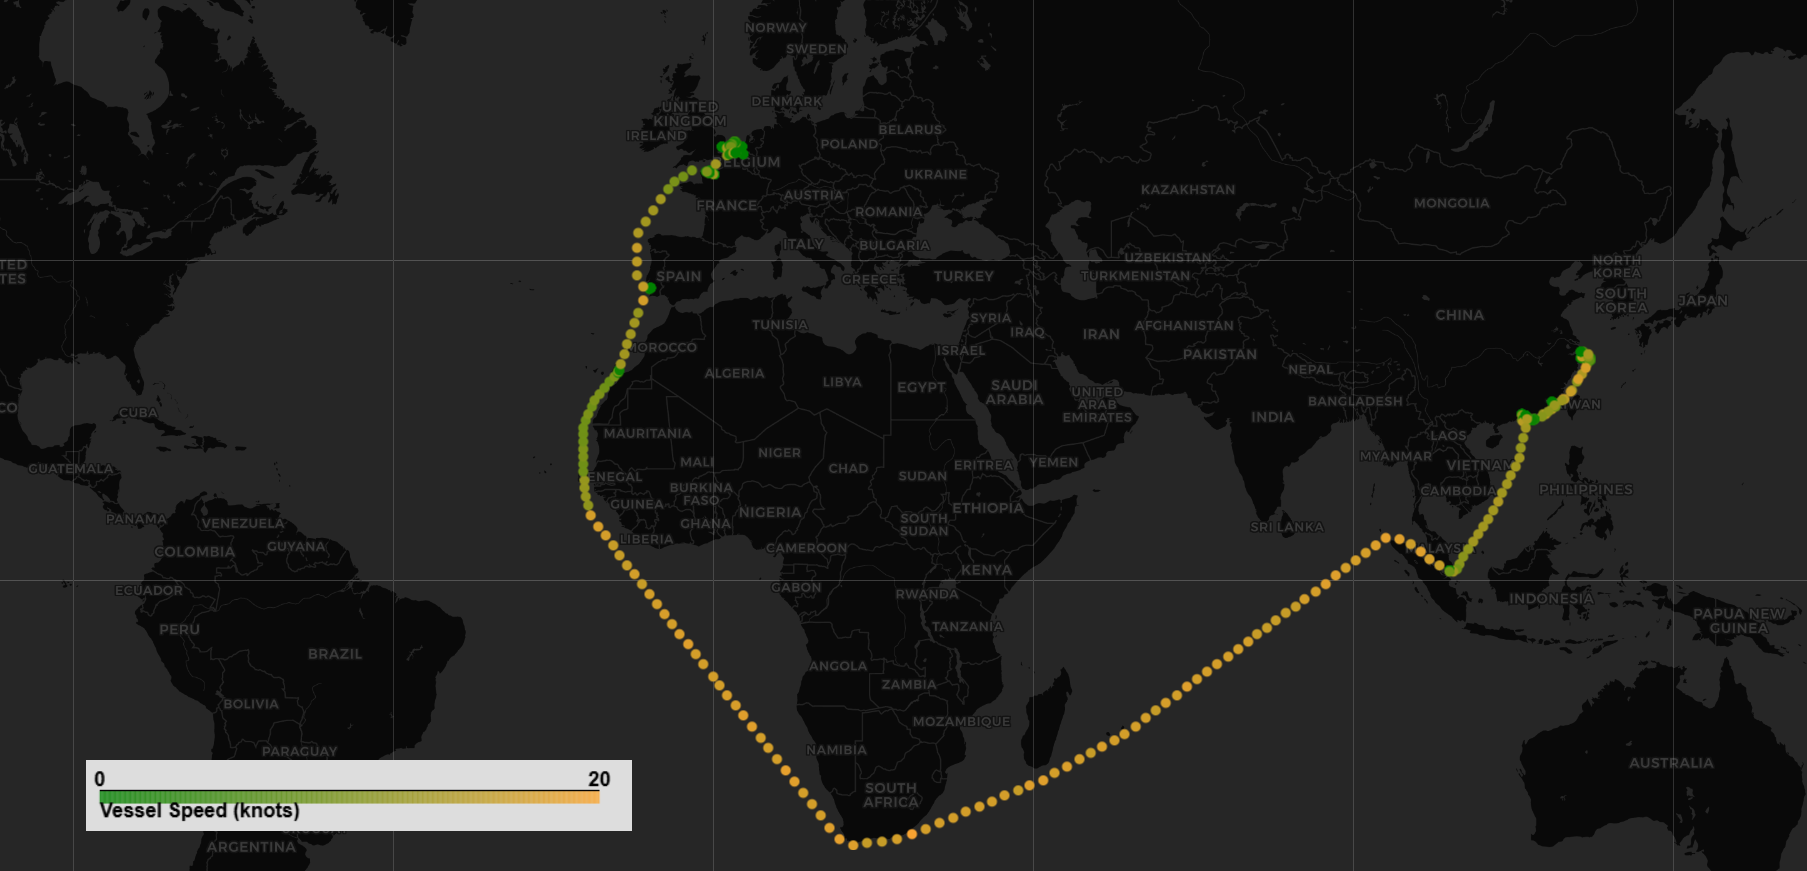
This code captures 4 months of history (with 4 points per day) for a containership deployed on a “North Europe – Far East” trade.
The result enables you to easily plug the data on a map to visualize the vessel’s passage as per screenshot.
1
2
3
4
5
6
7
8
9
10
11
12
13
14
15
16
17
18
19
20
21
22
23
24
25
26
27
28
29
30
31
32
33
34
35
36
37
38
39
40
41
42
43
44
45
46
47
48
49
50
51
52
53
54
55
56
57
58
59
60
61
62
import requests
import pandas as pd

token = "INSERT MY TOKEN" # your personal token for AXSMarine apihub
vessel_imo = 9839272 # The IMO of the vessel you want to track

# For all API call to AXSMarine apihub, you need to send your token in the Authorization header
headers = {
    "Authorization": "Bearer {}".format(token)
}

#Calling the Ship Status API
url = "https://apihub.axsmarine.com/global/ship-status/v1"

variables = {
    "first": 5000,
    "after": None,
    "snapshotTime": {
        "from": "2024-12-01"
    },
    "vesselImos": [vessel_imo],
}

query = """
query ($first: Int, $after: String, $snapshotTime: RangeDate, $vesselImos: [Int]) {
    historicalStatuses(
        first: $first
        after: $after
        snapshotTime: $snapshotTime
        vesselImos: $vesselImos
    ) {
        pageInfo {
            endCursor
        }
        edges {
            node {
                time
                ais {
                    latitude
                    longitude
                    speed
                }
            }
        }

    }
}
"""

data = None
while True:
    response = requests.post(url, json={'query': query, 'variables': variables}, headers=headers)
    response.raise_for_status()
    json = response.json()['data']['historicalStatuses']

    data = pd.concat([data, pd.json_normalize([i['node'] for i in json['edges']])])

    if len(json['edges']) < variables['first']:
        break
    variables['after'] = json['pageInfo']['endCursor']

data.to_csv(f"{vessel_imo}_history.csv", index=False)
POST
/
Select
1